The Swingex Index In Action
Want to understand better now the Swingex Index can help you anticipate turns in the market? Here are a few examples from the second half of 2024.
Example 1: July/August 2024
Many traders remember the nauseating plunge in the market at the beginning of August 2024, in particular the 3% drop on August 5. Less remembered is that the market actually peaked in mid-July. From the top on July 16, the S&P 500 dropped 8.5% in 14 days of trading. The Swingex Index had picked up the scent of something going wrong starting on July 3. The Index remained negative through July 16, providing a warning that there was trouble around the corner.
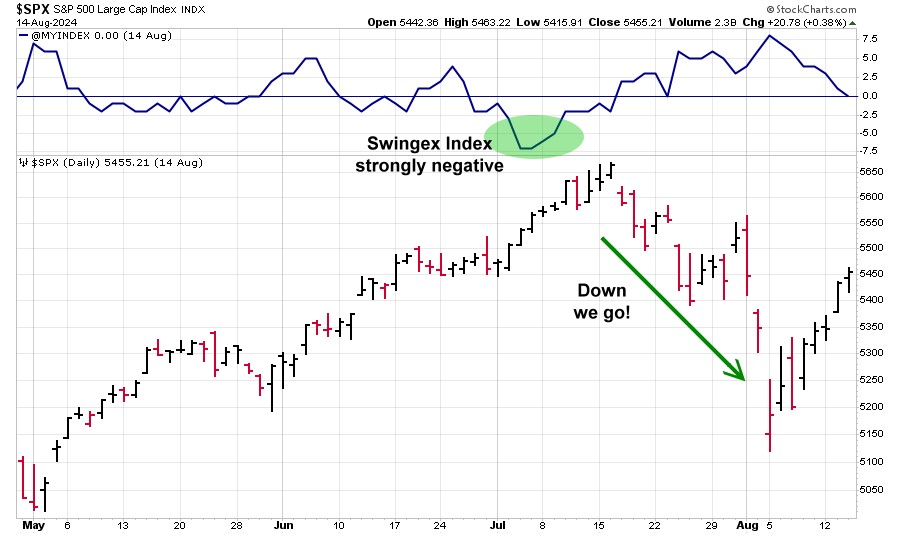
And BTW, on the day the market hit bottom the Index perked up to a very bullish +8 reading.
Example 2: Autumn 2024
By late August, the market and the Index both were taking a late-summer nap. That all changed the first week of September. There was a sharp selloff in the market, but the Index didn't panic. Instead, it gave us a series of bullish readings in the 6-7 range. Two weeks later, the S&P 500 was up 6%.
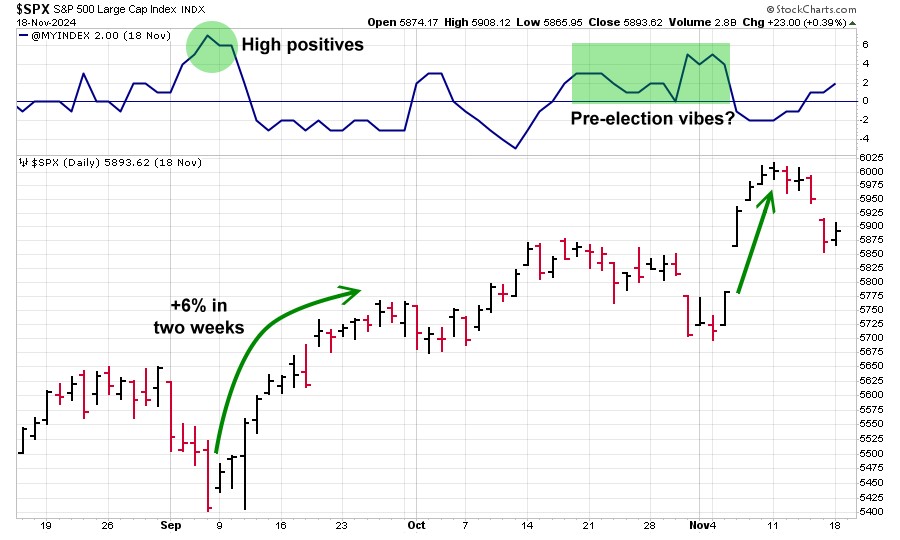
Later in the fall, as the U.S. election approached, the Index was consistently positive while the market drifted sideways to down. What did the Index know, and when did it know it?
Example 3: December 2024 rollercoaster
Something truly incredible happened in the stock market during the first three weeks of December. Every day, for 14 days in a row, more stocks went down than went up. The Swingex Index was warning us in advance that a storm was coming. It turned negative beginning on November 21 and remained underwater through December 6. The chart below uses the equal-weighted version of the S&P 500 to more clearly show what was happening under the surface at the time.
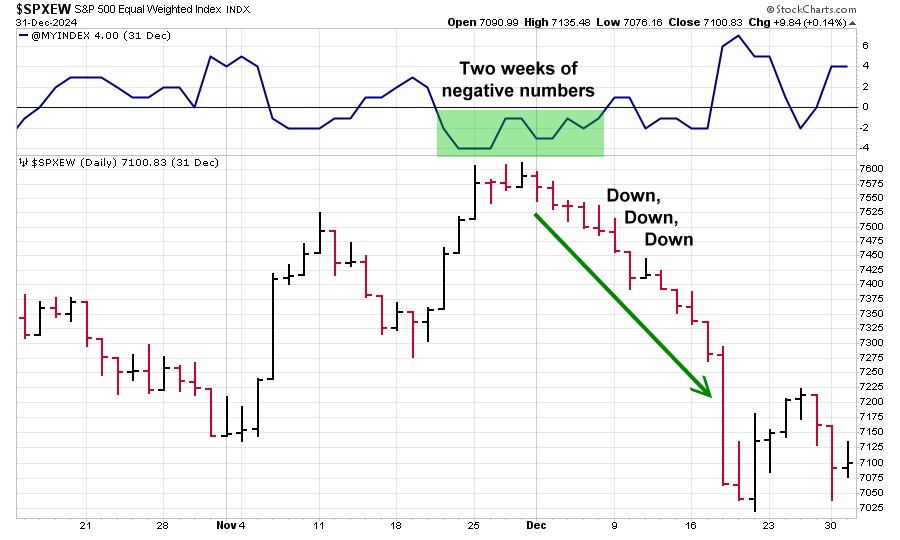
On the flipside, at the same time the stealth selloff was reaching its climactic end, the Index turned around and gave us some very bullish readings.
Learn more about the Index on our Frequently Asked Questions page.
See today's value of the Index.